
Enablement
FAQs
Which data tool should I use for instance data?
Data sources
Product data
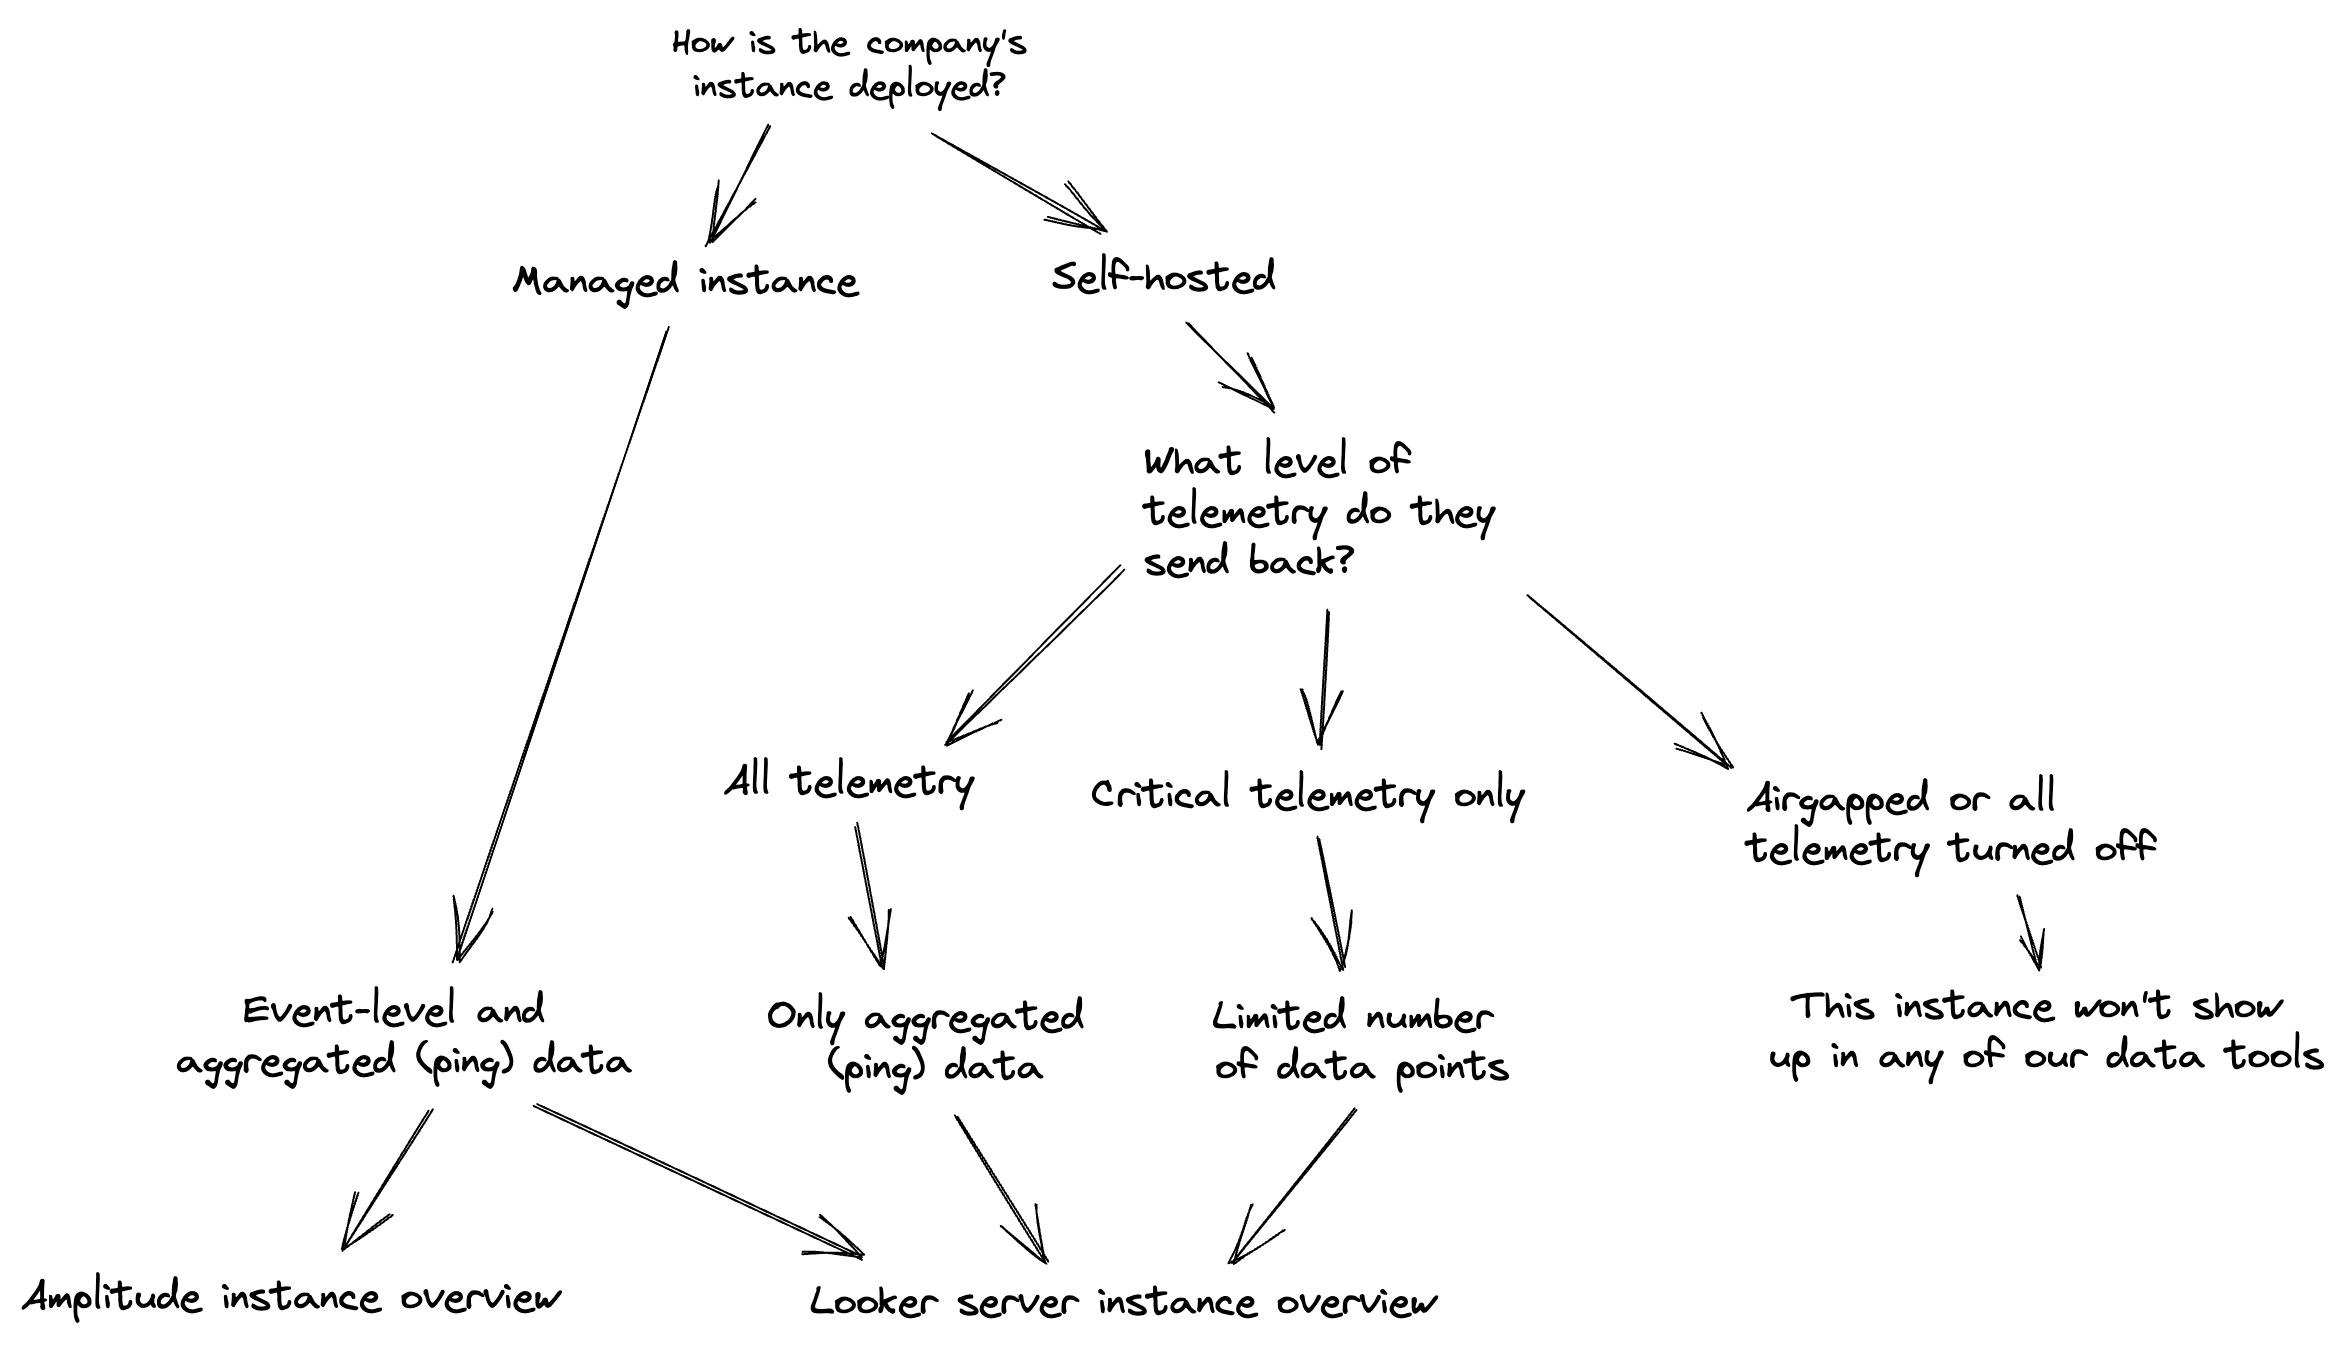
We collect two different levels of product data. The type of data we collect depends how an instance is being hosted.
- Pings we collect pings from Sourcegraph cloud, self-hosted, and managed Sourcegraph instances. These pings contain anonymous and aggregated information. There are specific guidelines that must be followed for teams to add ping data.
- User-level data: we collect anonymous, user-level, event stream data from Sourceraph cloud and Sourcegraph managed instances using our event logger. The event stream is data that is collected at the time the user does something in the product. That means, what did they do, when did they do it, what was the outcome.
If you’re interested in which kind of data you can see for a given customer, you check their telemetry status here. The options are as follows:
- No telemetry: This self-hosted customer has an airgapped instance, or has turned pings off. We don’t have any data about this customer’s product usage
- Critical pings: This self-hosted customer has elected to send us only the pings that are required for billing, support, updates, and security notices
- Full pings: This self-hosted customer sends us all the aggregated, anonymoous data we outline here
- Full pings + user-level data: This managed instance customer sends us all the aggregated, anonymous data outlined in our documentation, in addition to anonymous, user-level, event stream data from our event logger
Other data sources
We also load data to the BigQuery from:
- Google Analytics: Website analytics for Sourcegraph pages (marketing,docs,sourcegraph.com)
- Google Tag Manager: Tag management system to collect event data and execute custom scripts across marketing our sites (i.e. (about|info|docs).sourcegraph.com)
- HubSpot: Marketing automation (forms and emails)
- Salesforce: Customer Relationship Management system (CRM)
- ZoomInfo: Data enrichment of account and contact information
- Sourcegraph.com Site-admin pages: customer subscriptions and license keys
- Sourcegraph production database: we query a few particular tables from the production database via terraform to access data for Sourcegraph cloud.
- Google Sheets: There are a number of spreadsheets that Looker queries (by way of BigQuery).
- Zendesk: support ticketing
- BambooHR: employee HR system (in progress)
- CaptivateIQ: sales quotas (in progress)
Tool Specific Resources
Support Model
Supporting a Self-Service framework for BI and Analytics is imperative to being a data driven organization.
This framework consists of three principles:
- Give the right people the right set of tools and capabilities
- Create a collaborative environment
- Create a process to govern how this collaboration leads to continuous improvement of our analytics capabilities
Personas
In our Self-Service framework, we need to accommodate multiple personas because not all users will want to self-serve the same way.
Viewers
- Viewers are interested in standardized reporting on standardized metrics. They are interested to see how metrics change over time and may want to drill into specific datasets for those metrics. Viewers will request new standard metrics or new filters on current standard reports. They will also request new views and reports. Viewers may want to create their own views or dashboards for their own personal use.
- Examples of use cases of a viewer _ I want to view standard/trusted reporting on multiple topics _ I want to filter results with a set of standard filters _ I have a set of metrics that I am measured against and want to track progress of those metrics _ I want to automate a set of metrics that I report out on regularly
Creators
- Creators are interested in all the components of a Viewer, but will also want to create their own views/reports. Creators will also want to perform ad-hoc analysis. They are interested in both standard metrics and new/undefined metrics. They may be able to write queries directly against a data warehouse. And creators will use our standard tools, but may use other tools that are not part of the Data and Analytics tech stack.
- Examples of use cases of a creator _ I want to create and share views/reports on multiple topics across multiple standard tools _ I want to perform ad hoc analysis _ I want to query the DWH to understand and analyze data quickly _ I want to automate analysis